


Overview for the week and 5-day outlook to Wednesday 28 February 2018
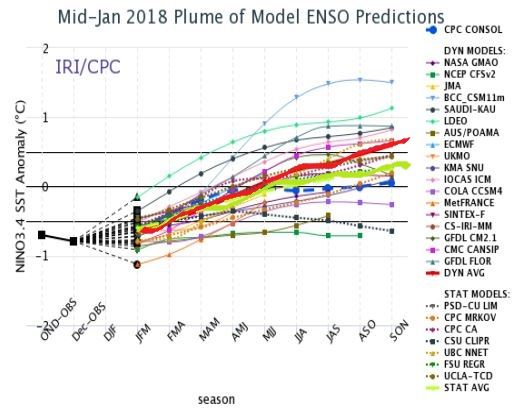
Graphs: IRI/CPC Pacific Niño 3.4 SST Model Outlook by the International Research Institute (IRI) for Climate and Society on 18 January 2018. Published by the Climate Prediction Centre in the National Oceanic and Atmospheric Administration (NOAA) of the United States Government on 19 February.
www.cpc.ncep.noaa.gov/products/analysis_monitoring/lanina/enso_evolution
The second graph is also from the Climate Prediction Centre but based on the CFS.v2 Forecast.
What Happened
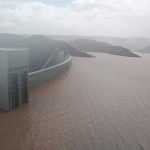
The last three weeks saw a meandering South Atlantic high pressure cell. From a position due west of Oranjemund, its core first shifted southward, then slightly north again last week, and substantially south during this week. The 1024 mB zone inside the cell now sits at 40°S some 2000 km west-southwest of Cape Town. It is a good 1000 km further south than a month ago. This is a good sign.
The two graphs in this week’s weather discussion both come from the same publication. Both are so-called model plumes where each curve represents the outlook of a specific model, each with its own assumptions and bias. On a more popular level these type of graphs are simply called spaghetti graphs, a name which is obvious to see in both images.
In the first graph, two lines have been amplified in red and light green to show the distinction between so-called statistical and dynamic models. The distinction is not very important other to state that the divergence between the two coloured lines is important.
The second graph also shows a spaghetti plume based on other models but with a mean shown in black. This line represents the weight of statistical evidence for a particular outcome.
It is not necessary to drown in the technicalities but it is important to realise that climate predictions and weather forecasts work with the future so the anticipated outcome is never guaranteed. It is only based on statistical probabilities and these can change, sometimes significantly, with the slightest adjustment to any of the underlying assumptions.
The two graphs demonstrate this very well. According to the first, Sea Surface Temperature anomalies will turn positive this year in June, marking the beginning of a new El Nino phase, although it will take a good six months before it will actually be defined as such.
The second graph on the other hand, shows that La Nina conditions will continue at least until the end of the year although the expectation is for a borderline La Nina / ENSO neutral stance. There is no absolute way to know in advance which one of these two graphs will come closest to reality.
Historically there is a strong, observed correlation between the El Nino Southern Oscillation (ENSO) and rainfall patterns in Namibia. The longer La Nina conditions continue, even if they are weak, the greater the chance for a good local rainfall season, and the longer it will run.
This has much to do with the position of the South Atlantic high pressure cell. So far, Namibia has not experienced a good rainfall season. Other than Kavango East, Bushmanland, Bwabwata and the Caprivi, rainfall to
date has been isolated, highly unpredictable and restricted to only two brief interludes.
This season’s pattern has also been repetitive with relatively large distances between the high pressure cells, and short, high-intensity rain windows in between. But the overall dominant factor has been the position of the South Atlantic high. Every time a rain window presented itself, it was repelled, either by ridging in the upper air, or by the high’s impact on the surface, simply displacing the influx of tropical air from the north. The result can be seen in the disappointing rainfall totals for the season.
The relationship between the South Atlantic high and ENSO in the tropical Pacific Ocean has not been studied extensively. It is mostly based on observation without any durable conclusions other than the historical correlation.
What the current La Nina in the Pacific Ocean, and the recent shift of the South Atlantic high tell us is that there is still much activity left for this rainfall season.
What’s Coming
There is again much variance between the leading forecasts but the general expectation for the weekend is no or very limited rainfall for almost the entire country except Kavango West, Bwabwata and Zambezi.
Their is however agreement about high pressure control on the surface as well as extensive ridging over Namibia’s southern half, over most of Botswana and the entire Karoo region. This means very hot days with blistering late afternoon as far north as Otjiwarongo.
By Monday, a strong low-pressure system develops over Western Zambia, similar to a fortnight ago when Namibia enjoyed the first meaningful rain window for this year.
A weak mid-level trough runs from Angola through Namibia into South Africa, gathering strength from Tuesday onwards. This will bring extensive cloudiness to the interior but with limited rainfall.
The only positive aspect for the next five days is that next week’s trough will traverse the whole country from the Angolan border to the Orange River, so there is a chance for rain across the entire country above the escarpment. Falls are expected to be isolated or sporadic at best.


