


The Week’s Weather up to Friday 22 December. Seasonal outlook for January 2018
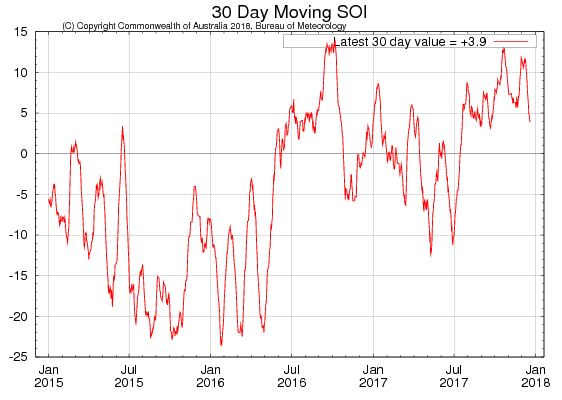
Graph: 30-day Southern Oscillation Index maintained by the Australian Bureau of Meteorology.
Source: http://poama.bom.gov.au/climate/enso/#tabs=SOI
This week saw a local weather pattern very similar to the previous week with the big exception that the active system in the convergence zone developed considerably further west than expected a week ago.
Although widespread showers occurred from Omusati in the north-west across the interior and deep into the south-east, the downpours were still more isolated than widespread. Heavy falls were reported from farms north of Okahandja, from Tsumeb, from Windhoek, from a farm near Witvlei, and further south along the Botswana border. According to the Meteorological Service, however, no rain has fallen since May this year.
The noteworthy feature of the week’s rainfall is that the heaviest showers occurred on the western fringe of the convergence zone. This is a clear indication of ample humidity in the middle and upper levels of the atmosphere, and it only requires a little upward lift for convection to set in and create an unstable atmosphere.
Rainfall from stable air is very rare in Namibia. It is more a feature of tropical rainfall but then from a cloud base that is very low, usually only at about 8000 feet. Here, a cloud base of between 10,000 and 12,000 feet is the norm, but then it requires active and strong convection. This is what the convergence zone creates. It is the region where the surface air that penetrates from the south-west encounters the mid-level air coming from Angola and Zambia.
This interaction is most readily observable on the so-called 500 mB surface maps where instability is tracked and forecast. Within the larger convergence zone, smaller, localised pockets of stronger convergence occurs. Since the 500 mB maps are mostly concerned with lateral movement, there is a strong rotational bias in what the maps portray. It is almost like mini vortices higher up interspersed with areas of ridging, meaning low pressure pockets offset by larger areas of stable air.
It is on the western rims of these small pockets of unstable air that thunder showers develop that can produce such surprising results as Wednesday’s downpour in Windhoek and surroundings.
As the season moves into the period after the austral solstice, this inherent instability in the middle layers will become more enhanced. Although there will almost always be a high pressure influence in Namibia close to the surface, the instability in the middle and upper layers is what is required for good convection. The simplest way to observe this is to look at the cloud tops. The higher they develop in the late afternoon, and the more the cumulonimbus clouds resemble large heads of cauliflower, the more conducive upper air conditions are for convection and consequently, precipitation.
For the duration of the week, the outer rim of the South Atlantic high pressure cell remained offshore, only crossing the southern Cape. With a strong anti-cyclonic circulation over the sub-continent, advection of moisture was robust and the offshore locality of the high enabled the convergence zone to move to the west by a couple a hundred kilometres.
What holds the season?
The Southern Oscillation Index shows the latest values in the difference in barometric pressure between Darwin on the north-eastern coast of Australia, and Tahiti, about 1000 km further east in the Pacific Ocean. The daily value is compared to the value a month prior and three months prior. This gives a 30-day and a 90-day index value.
While it is clear that the 30-day value has come down to below +7, the 90-day value is still at +7.6. What this mean is that, over the longer measurement, La Nina conditions are still in the offing. La Nina is generally recognised when the index is higher than +7.
The index indicates that overall conditions are generally positive for a normal to above normal rain season in Namibia for January, February and March. Since January is traditionally Namibia’s highest rainfall month, this is a rather useless outlook and much depends on locality and daily intensity. It is also a natural feature of the main Namibian season that it starts in the north during December and that it slowly migrates to the south and the west during February and March.
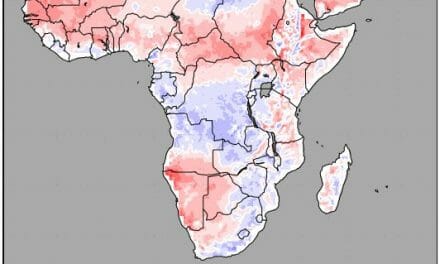
At this moment, the southern boundary of the Inter-tropical convergence zone, the ITCZ, is wandering in southern Angola which is a positive sign but the mid-level atmosphere over eastern Africa is fragmented although not nearly as bad as a year ago. It is this combination of natural factors that prevent forecasters from ranking the expectations for the impending season too high.
The positive oscillation index coupled with the persistently cooler water in the eastern Pacific, indicate a continuation of La Nina conditions up to about May next year, but the consensus expectation is for a weak La Nina.
The rainfall outlook is positive although not overly optimistic. A conservative approach is to view the season as relatively normal so far. Much depends on the locality and the strength of the South Atlantic high pressure cell. Namibia needs only a four to five-day window between the passing of the previous cell and the advent of the next, to experience good rains. This window occurs fairly regularly every eight to nine days during summer and there are no current indications that the repetitive pattern will not continue in January.


