


Weather Overview and short-term outlook to Wednesday 25 March 2020
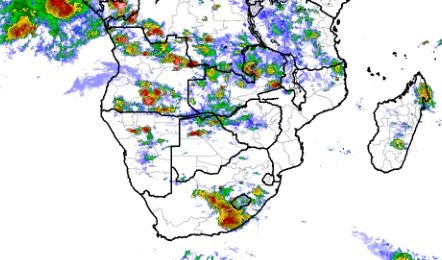
Visual: Snip from animation of central and southern African precipitation from Wednesday 18 to Friday 20 March.
Source: Climate Prediction Centre in the National Oceanic and Atmospheric Administration (NOAA) of the US Government.
https://www.cpc.ncep.noaa.gov/products/international/africa/irloop_af.html
This week’s visual is just a small snip from a specific frame in a GIF file that is far too big to try and upload into the article. Click the link above to watch the full animation. It starts at 12:00, 18 March and runs to 11:00, 20 March. Times are indicated as universal time (Z) so the Namibian time is the indicated time plus 2.
These fantastic visuals show the weather, notably precipitation (rainfall) as it happens every hour. The images are not captured by a camera but instead by a satellite with sensors that detect changes in temperature as reflected by changes in refraction, i.e. longer wavelengths equals colder temperatures while shorter wavelengths indicate warmer areas. This data then goes to a computer that generates the images and sequences them in an animation.
These animations are very reliable as live indicators of actual conditions despite the fact that a conventional type image was never captured like a photograph. Furthermore, NOAA is generally regarded as the world authority on weather. This is not by chance. As a US Government agency, it has access to the highest level of funding, compared to other weather organisations; it runs the most powerful batteries of computers, similar to defence-level computing power; and it has access to the biggest number of eyes in the sky (satellites). This combination places them at the top of any and all weather analysis and forecasting.
This particular animation shows a number of interesting features that have a bearing on how our local weather develops, and what is in store for the immediate future but also a bit further out to about 10 days.
First to notice is that the Indian Ocean Transport has suddenly, within the last week, switched direction and is now moving strongly from the Indian Ocean north of Madagascar entering the continent along the Tanzanian coastline. The movement from east to west is very pronounced with an extensive zone of vapour running from Tanzania into the DRC, southern Angola and Western Zambia, and from there into northern Botswana and Namibia.
Second, the mid-level trough is visible as the local zone within which most of the convection occurs causing the highest level of precipitation.
Third, the trough depends on energy to develop and function properly as indicated by the relative weakness of the system during the night and morning, and its strength during the afternoons and early evenings.
Fourth, the animation shows how big the local impact of the South Atlantic high pressure cell is and how fast it has migrated from west to east this week. Despite being relatively weak at 1020 mB and somewhat displaced to the north, this is the single most important element of Namibia’s weather. We can receive as much vapour as we want from the north, if the South Atlantic high does not cooperate, the rainfall is disappointing.
The absence of high pressure control was demonstrated this week by good thunder storm development and much lightning over many areas in Namibia where unstable air caused local active storm cells to develop. Lightning is an indication of convection. The rule is: the less high pressure control, the more unstable the air, the stronger the convection and the better for thunder storms to develop.
On the Radar
Given the improvement in conditions north of Madagascar and over western Tanzania, there is a reasonable (rational) expectation that the rain season will be prolonged in Angola and that Namibia will receive the spill-over through the mid-level trough every 4 to 6 days. This may continue until early May.
For the weekend, conditions continue mostly the same as this week with good cloud development east of the escarpment. The mid-level trough stays active and in situ from the north-west (central Kunene) through the Namibian interior into South Africa. This means that there is up to a 30% chance of rain in this broad zone that covers about one third of the interior.
With the southern boundary of the Inter-tropical Convergence Zone hugging the Namibia Angola border, it means rainfall prospects remain favourable for the Kavango, Babwatwa and the Caprivi.
By Monday the trough weakens but remains located over the northern and central interior, so while rainfall prospects diminish, various forecasts still show a good probability for showers but these will be very isolated. Still, with local conditions being very volatile, these storms may surprise with their intensity.
By Tuesday the current mid-level trough has become inactive but conditions are already developing to prepare for the next trough. This means that positive rainfall prospects will shift to the Oshana, Omusati and Kunene regions and western Etosha.
On these two days, zero rainfall for the rest of Namibia is indicated.


