Overview for the week and 5-day outlook to Wednesday 22 August 2018
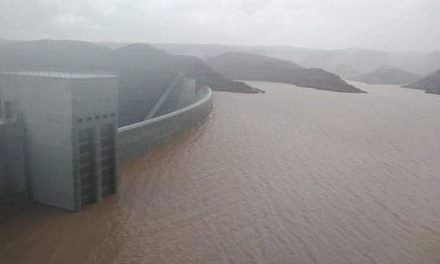
Visual: Midday synoptic map of surface conditions on Thursday 16 August Source:...
Read More


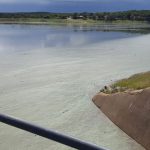


Visual: Midday synoptic map of surface conditions on Thursday 16 August Source:...
Read More
Visual: Mean surface temperatures (top) and anomalies (bottom) for the next week. Source:...
Read More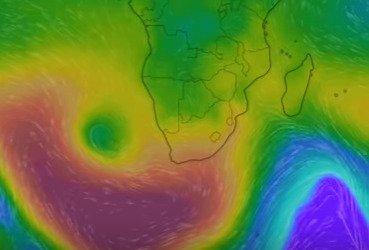
Visual: Clip from a colour-enhanced graphic showing surface highs and lows for the southern...
Read More
Visual: Synoptic map of surface conditions for midnight 26/27 July Source: South African Weather...
Read More
Visual: Clip from the sea level pressure chart for the southern hemisphere on Friday 20 July...
Read More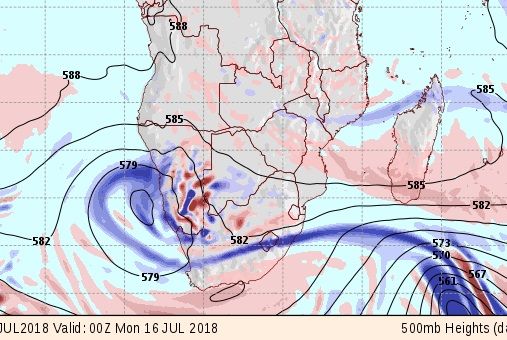
Visual: Wind vorticity and height of the 500 mB surface on Sunday 15 July Source: GrADS/COLA,...
Read More
Visual: Southern Africa surface precipitation outlook for Saturday 07 July Source:...
Read More
https://economist.com.na/wp-content/uploads/2018/07/WvB-sandstorm-opt.mp4...
Read More