


Food drives inflation up
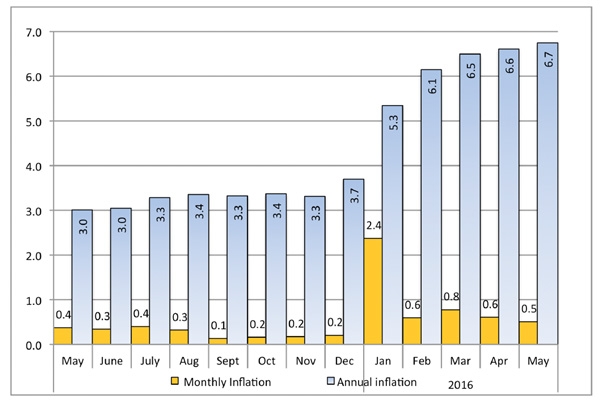
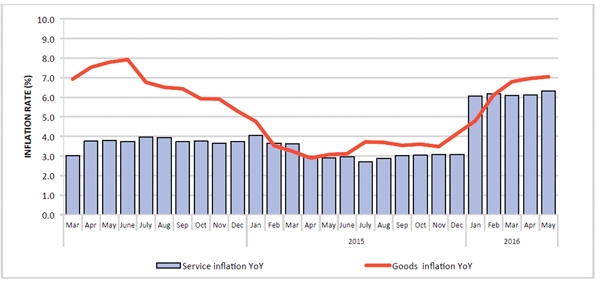
NCPI; Goods and Services monthly and annual inflation rates
In May 2016 the index measured 122.4 and 115.6 respectively compared to 114.3 and 108.7 in May last year. For May 2016, the monthly and annual inflation rates for Goods were 0.7 % and 7.1 % while Services stood at 0.2 % and 6.3 %. In May 2015, the monthly increase was 0.7 % and the annual increase 3.1 %. The base year is 2012.
The annual inflation rate for food and non-alcoholic beverages was recorded at 12.2% in May 2016 compared to 4.5 % in May 2015. This is a 7.7 percentage point increase. The most drastic price movements were recorded for fruit, up 20.6 %, vegetables, up 20 %, oils and fats, up 19.2 % and bread & cereals, up 16.1 %, according to the May 2106 Consumer Price Index as published by the Namibia Statistics Agency.
The May 2015 All Items Index measured 119.4, an increase of 7.5 index points over May 2015 at 111.9. The year on year increase for housing, water, electricity, gas and other fuels was 7.6 %, for transport, 1.5 %, for recreation and culture, 6.4 %, for education 7.6 %, and for hotels, cafes and restaurants, 9.1 %.
However, the overall rate of inflation growth declined marginally from 0.6 % to 0.5 % from April to May.
Main Drivers of Inflation
The Statistics Agency said the increase in the annual inflation rate for May 2016 resulted from increases in all the groups except the clothing and footwear component which declined from 2.4 % recorded in May 2015 to -2.1 % in May 2016. Recreation and culture increased to 1.3 and 1.8 % recorded in the current month from -0.1 and 0.3 % registered in the previous month respectively.
Basket weights
Explaining the index composition, the agency said inflation is calculated based on a basket of goods and services, containing a representative sample of the goods and or services commonly consumed and weighted relative to the typical (average) consumption pattern at household level.
The price of these goods and services are then tracked over time to illustrate the change in the cost of living over time. As spending patterns change, new products and services are added to the basket, and the basket reweighted to represent more accurately the current spending patterns of the consumer at the current point in time.
“As such, the inflation basket is generally reconstituted every five years. The basket was last rebased in 2013, using household expenditure data collected in the 2009/10 Household Income and Expenditure Survey. The basket now contains over 350 items, grouped into 12 categories and 55 subcategories, for which prices are collected on a monthly basis from more than 900 retail outlets.”
Namibian inflation however, is largely determined by four categories of the overall NCPI basket, namely (i) Housing, water, electricity, gas and other fuels, (ii) Food and non-alcoholic beverages, (iii) Transport, and (iv) alcoholic beverages and tobacco. Collectively, these four categories make up well over 70% of the total basket.
“As such, a large increase in these categories has a greater impact on the overall inflation than do increases in the lower weighted categories” according to the agency.


