


Standard Bank officially the worst
In order to evaluate and compare the local banks we developed a ranking system based on several of the ratios and data contained in this report whereby we rank the four local banks from “1” to “4”, with 1 being the best and 4 the worst. The ranking system consist of 5 categories namely profitability, cost efficiency, credit risk, advances growth & market share and capital adequacy. In this report financial ratios were based on the most recent financial statement data and all compounded growth numbers on three years to represent the category. Each category and sub-category are assigned a weighting based on our opinion of the relative importance of each in order to determine the ranking for each bank.
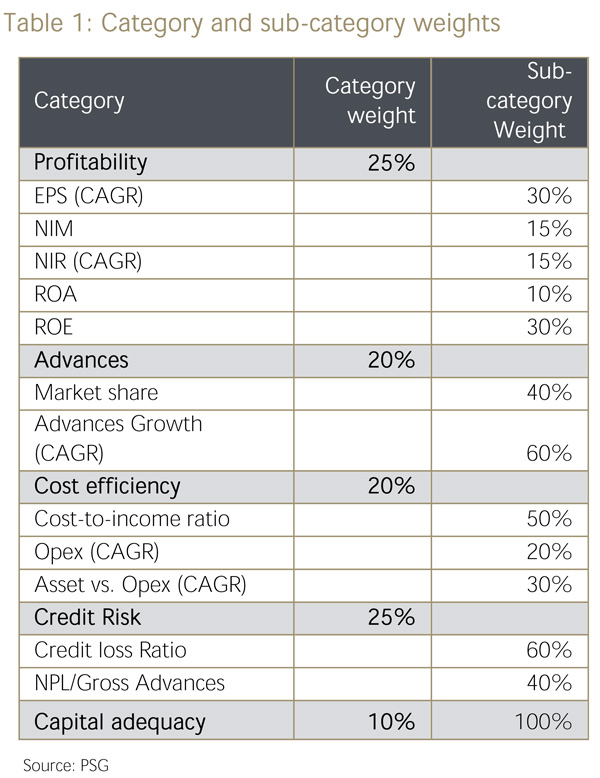
Under the ranking system a greater emphasis is placed on profitability and credit risk, these two categories account for 50% of the total weighting. We allocated a weight of 20% each to advances and cost efficiency categories whilst the capital adequacy category represents 10% of the total weighting. The categories and sub-categories and the respective weights are shown in the table 2 below.
Click on table to view in full size.
Within the profitability category EPS growth and ROE were assigned more weight relative to the other profitability metrics mainly due to the importance attached to it in the valuation process and since they represent how successful a bank’s strategies are implemented. Similarly the cost-to-income ratio carries the biggest weight in its category. The credit loss ratio has been assigned 60% of the weight in the credit risk category because we regard actual impairment of advances more important than NPLs that can still become performing loans.
The ranking system does not consider liquidity ratios since the optimal liquidity ratio will differ between banks depending on the risk profile and is open for interpretation. Moreover, there is a fine line between too much liquidity and too little making ranking banks according to this metric problematic. While service delivery could play a significant role in the rankings it was not included in the ranking system given the subjective nature of assigning a rating. We opt to include market share and advances growth which to some extent is an indication of service delivery since a bank with poor service will find it difficult to grow or maintain market share.
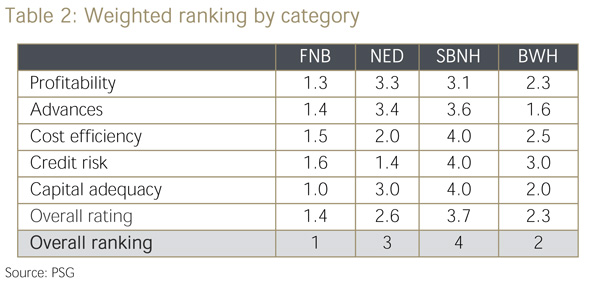
We rank FNB the best bank in Namibia as it consistently came in 1st in all but 5 of the 13 sub-categories. It scored a further 4 second place rankings and 1 third ranking. BWH is ranked a close second, trading first and second places with FNB in 7 sub-categories. NED is ranked 3rd followed by SBNH in 4th place. SBNH ranked 4th in 9 of the 13 subcategories.
Click on table to view in full size.
Table 3 shows the rankings for each bank by category and subcategory.

Click on table to view in full size.
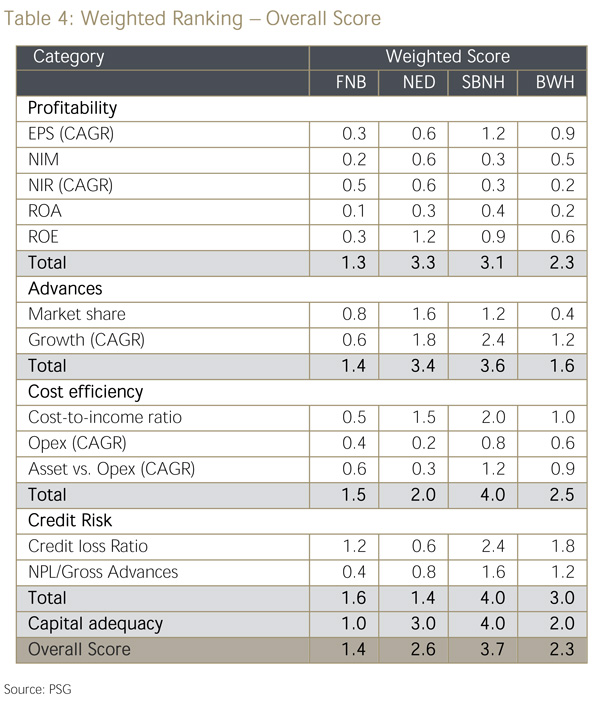
Looking at the rankings in terms of profitability, it shows that FNB and BWH were rated number 1 and 2, respectively. FNB’s high ranking is due its number 1 ranking in 4 of the 5 subcategories.
Click on table to view in full size.
In the advances category, FNB and BWH is ranked 1 and 2 again. The reason for this is that these banks have grown advances at a faster pace than other banks over a three year period and also have the largest advances market share at 32.1% and 32.8% at December 2014.
In terms of cost efficiency, FNB ranked first again, which makes it the most cost efficient bank, because of its significantly lower cost-to-income ratio.
The credit risk category contains the credit loss ratio and NPL/advances ratios with a weighting of 60% and 40% each. In this category, NED ranked first making it the bank the best at managing its credit risk. FNB is ranked 2nd in the credit risk category. FNB is also ranked first in the capital adequacy category with its higher capital adequacy ratio. The rankings are based on the financial statement data which could differ between banks in the way certain items are reported.
The ranking system is based on backward looking financial statement data and should not be used for investment decisions which should be based on various factors.
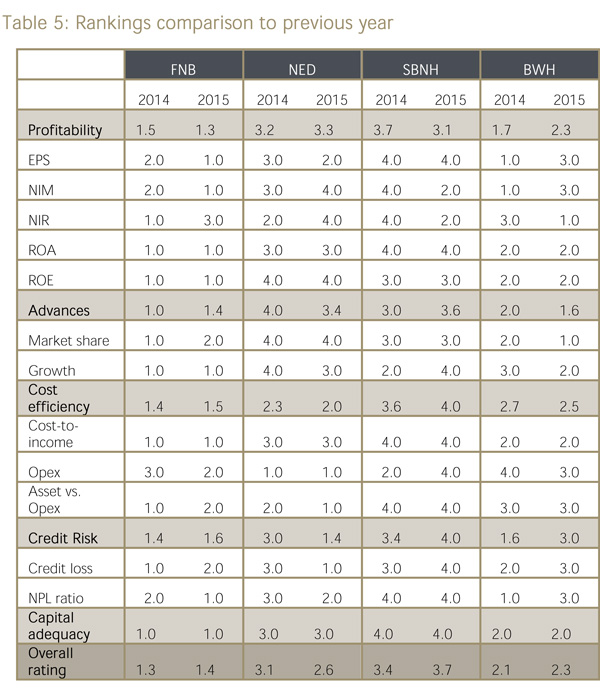
Click on chart to view in full size.
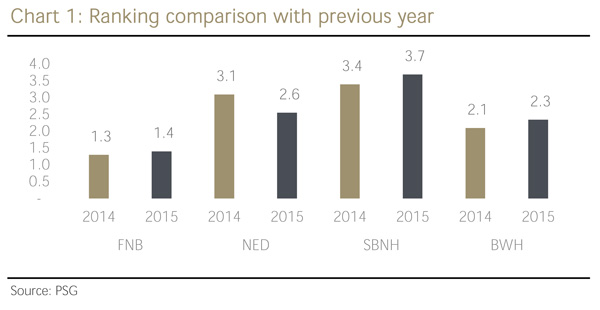
The above chart shows how the banks’ rankings changed from the one year to the next. Even though there was no change in the overall standing of the banks, it is only NED which showed an improvement overall in rankings terms. They are moving closer to BWH and at 2.3 for BWH and 2.6 for NED they are not far apart. This is largely due to their improvement in their credit loss ratio and their 5 year asset growth.
Click on table to view in full size.


